
ERP Kung Fu with Pandas
We can take advantage of the capabilities of modern analytics libraries in order to gain more detailed insights into projects than the ERP tool on its own would allow. Particularly the Python library pandas is currently very popular and is frequently applied in analytics.
It allows to load, properly transform and visualize Excel exports of the ERP directly. A usable Excel export from the ERP can be obtained by clicking Manage/Bookings in the project management pane and choosing the option “Open in Office”. The currently visible display is exported. Depending on the application, it might be necessary to add additional fields (such as activity number or the number of hours booked) before exporting.
Unleash the Pandas
We load the Excel export as a pandas.DataFrame:
import pandas as pd
df = pd.read_excel("Projektbuchungen_636843550793374935.xlsx")
We are interested in the history of the hours booked, split according to different attributes. The goal is to create a new DataFrame that contains only the time series to be displayed. It shall use a time index that covers the relevant time period. We split the data using the groupby operation according to the value of a column, we group the hours by date, sum the entries of each day and reindex in order to achieve that each new time series extends over the same time period. Then we combine all time series to a single DataFrame and plot it:
def plot_hours_by_column(df, col, cumulative, plot_kind):
    dates = df["Datum"]
    full_index = pd.DatetimeIndex(start=min(dates), end=max(dates), freq='1D')
    series = {}
    for key, pdf in df.groupby(df[col]):
        hours = pdf["Menge"].groupby(pdf["Datum"]).sum() \
            .reindex(index=full_index, fill_value=0)
        hours = hours.cumsum() if cumulative else hours
        series[key] = hours
    pd.DataFrame(series).plot(kind=plot_kind)
We can use this function to plot the hours accumulated by each team member (resources, names changed) over time:
plot_hours_by_column(df, "Ressourcenname", True, "area")
As a next step, we plot the history of the total time allocated to the various project activities. Since the ERP can only export activity numbers, we map them to the corresponding names beforehand.
activity_names = {"AK0005412": "Vorhersage", "AK0005413": "Optimierung", "AK0005415": "PM", "AK0005414": "Meetings"}
df["Aktivität"] = [activity_names.get(n, n) for n in df["Aktivitätsnummer"]]
plot_hours_by_column(df, "Aktivität", True, "line")
Finally, we are interested in the distribution of hours worked over the days of the week:
df["Menge"].groupby(df["Datum"].dt.weekday_name).sum() \
    .sort_values().plot(kind='barh')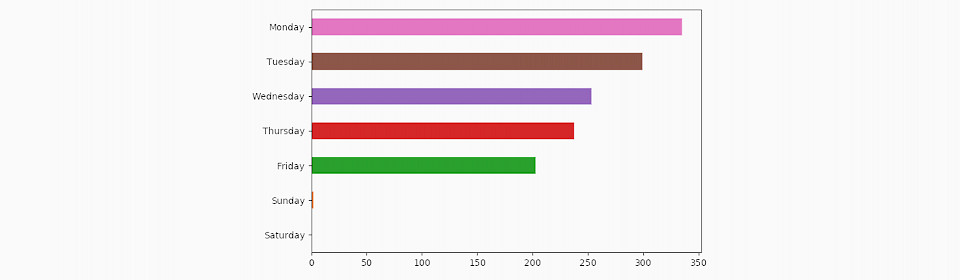
Authors
Dominik Jain / Senior Software Architect & Kristof Schröder / Software Architect / Business Division New Business
---